
MEC E 409 – University of Alberta Fall 2020 Semester
Introduction
For the 2021 competition year, the University of Alberta Formula Racing team set a target of being in the overall top 10 at competition and to place in the top 3 in the acceleration event. Overall position at competition is heavily dependent on successfully completing all events, while the acceleration event is heavily dependent on the vehicle mass and engine power. These goals have translated to braking subsystem goals of providing reliable and consistent performance with a reduction in the weight of braking components with particular focus on unsprung mass. Component mass is classified as sprung or unsprung depending on whether a component is supported or unsupported by the vehicle’s suspension, with unsprung mass having a much greater impact on overall vehicle performance primarily due to inertial effects. The UA-20 braking system has several unsprung components as part of the unsprung wheel assemblies, including the brake rotors. The current brake rotor design focused on a high factor of safety to ensure reliability, this project aims to improve vehicle performance by optimizing the front and rear brake rotor design. The optimization is to focus on providing consistent braking performance without mechanical failure and to reduce the mass of the rotors.
Final Design Report
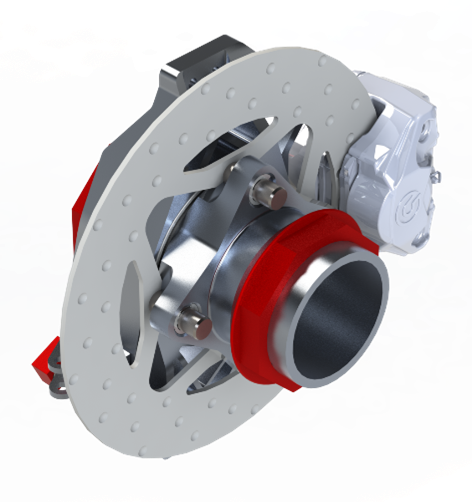
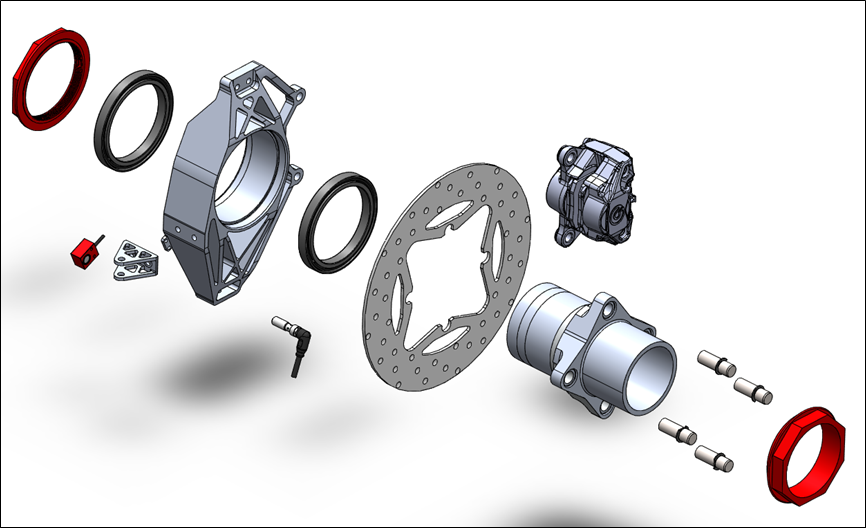
The final design to improve the brake rotors focuses on improving vehicle braking performance by optimizing the brake rotor mass and improving brake pad off-gassing effect mitigation methods. While the rotor interface to the vehicle, as shown in Figure 1, has not changed between UA-20 and UA-21, the current brake rotors were designed with a large factor of safety, and were likely much heavier than required for the low mass of the UA-21. Due to the size constraints of the wheel assembly, the design focused on reducing rotor mass by altering the thickness of the rotors. Brake pad off-gassing is typically handled by providing a relief area on the friction surface of the rotor for the gasses generated by heating the brake pads friction material to be released as they sweep past the brake pad.
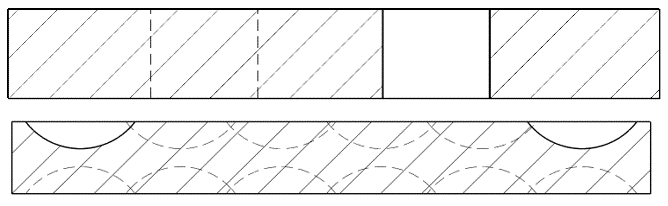
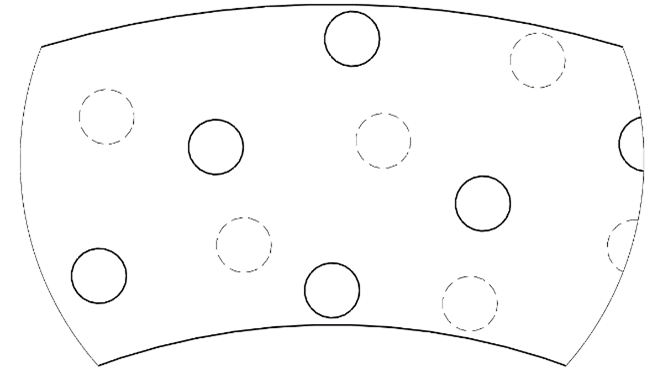
The UA-20 brake rotors attempted to mitigate the effects of off-gassing by cross-drilling the rotors, however the holes were positioned in such a way that only two arcs across the brake pads were able to release gasses. For the new design, this pattern has been optimized to ensure that the entire pad surface is given the opportunity to off-gas. Additionally, the cross-drilled holes have been changed to dimples, which increase surface area while reducing stress concentration at the edge of the feature and the friction surface. These changes, shown in Figure 2, were also coupled with offsetting the dimples on each side of the rotor as shown in Figure 3 to ensure adequate relaxation area between dimples.
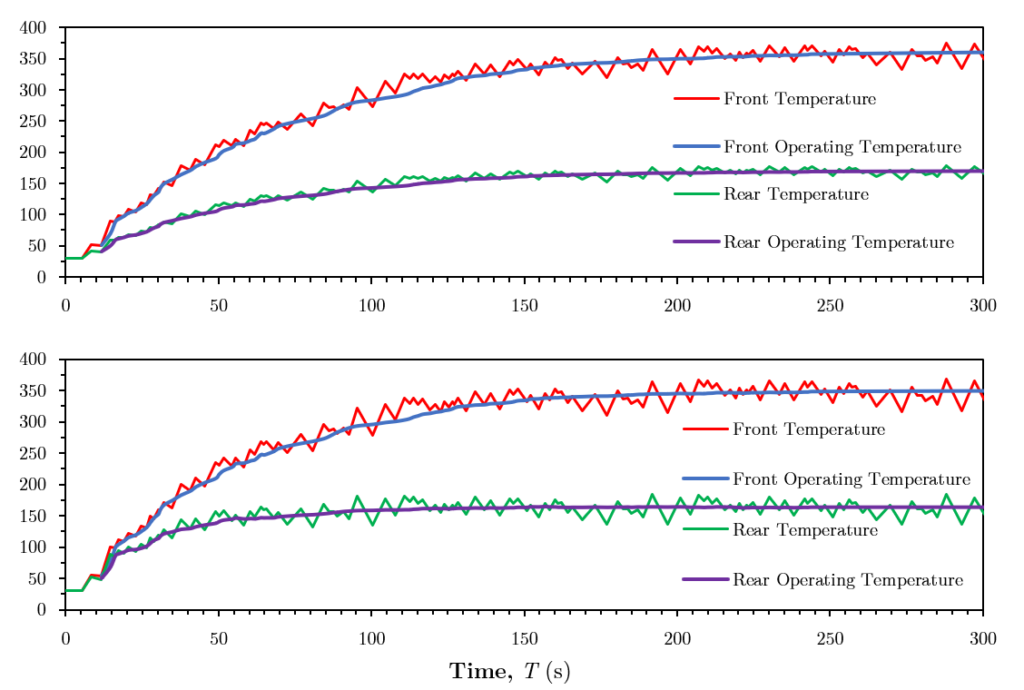
To determine maximum mass reduction for the rotors, a simulation model of the thermal properties of the braking system was developed. This model required vehicle dynamics data that accurately represented the conditions the vehicle will see during competition events. This event model was generated using the methods shown in Appendix A, which were used to develop a thermal model using the methodology shown in Appendix B. This simulation model, results of which are shown in Figure 4, shows that the previous brake rotor design required a significant amount of time to reach operating temperature, defined as a centered 50 second moving average of the actual temperature, taking almost 2 laps to reach 95% of operating temperature. The new design reaches 95% of operating temperature in approximately 1.3 laps. Additionally, the plots show that the front brake temperature deviate from the operating temperature much more than the rear brakes, this indicates that the mass of the rear rotors can likely be reduced by a larger amount than the front while still maintaining similar relative deviation from their respective operating temperatures. The friction surface was deliberately kept near the height of the brake pads in attempt to mitigate internal thermal stresses caused by temperature gradients.
An iterative approach in combination with FEA analysis as shown in Appendix D was used to optimize the geometry of the brake rotors to ensure the design meets strength requirements while also optimizing their thermal properties. With the thinner rotor, structures supporting the interface to the wheel hub were altered to reduce bending effects seen in the supports as seen in Figure 5. This also serves to reduce the mass of the rotor, as tensile and compressive forces induce significantly lower maximum stresses than bending. To validate the simulation, an FEA analysis was performed using the same methodology on the previous brake rotor models, which have been used in testing and at competition without experiencing failure and are therefore a known benchmark to compare the simulation results.
The methods used to manufacture the new design remain nearly consistent with the previous design, in addition, the same currently available stock of Dura-Bar cast iron will be used to manufacture the new rotors. Using the same material, worth approximately $300, and similar manufacturing methods, costing approximately $400, the new design remains within the stated budget constraints.
Future work for the current competition year is shown in Table 1 and includes what needs to be done to successfully compete at the 2021 Formula SAE competition validation events scheduled for June 2021. Beyond these tasks, future work will include analysis of internal thermal stresses due to temperature gradients within the brake rotors.

Table 1: Future tasks to compete at 2021 Formula SAE competition
| Task | Expected Completion Date | Criteria for Evaluating Success |
| Cut blanks from raw stock | February 1, 2021 | Rotor material has been cut into four blanks |
| Waterjet rotor profiles | February 15, 2021 | Rotor blanks have cut profiles |
| Machine interface features and dimples | March 1, 2021 | Rotors have all features |
| Grind surfaces to final finish | March 15, 2021 | Rotors have required surface finish |
| Adjust hub interface fitment as required | March 30, 2021 | Rotor to hub interface adjusted as needed to allow assembly |
| Assemble wheel upright | March 30, 2021 | Wheel uprights assembled with rotors |
| Assemble vehicle | April 1, 2021 | Rotors are assembled and on completed vehicle |
| Vehicle shakedown | April 15, 2021 | Vehicle has driven and stopped under its own power |
| Test brake lockup | May 1, 2021 | Vehicle has been able to lockup all four wheels during testing |
| Test braking systems | May 1, 2021 | Temperature data obtained from vehicle testing |
| Validate brake thermal properties | May 15, 2021 | Temperature and other vehicle data logs have been used to validate simulation models and empirical heat transfer coefficient has been determined |
| Validate brake friction properties | May 15, 2021 | Pressure and deceleration vehicle data logs have been used to determine the empirical friction coefficient of the brake friction surface between the pads and rotors |
| Attend competition | June, 2021 | The vehicle has driven and successfully stopped at competition |
Design Evaluation Matrix
| Item | Previous Design | New Design | Comments |
| Maximum Temperature | Front: 379 °C Rear: 179 °C | Front: 370 °C Rear: 184 °C | New design reduces maximum braking temperature while also weighing less |
| Operating Temperature | Front: 362 °C Rear: 171 °C | Front: 341 °C Rear: 162 °C | New design reduces operating temperature while also weighing less |
| Rotor Mass | Front: 787 g Rear: 629 g | Front: 657 g Rear: 389 g | New design reduces unsprung mass, increasing vehicle performance |
| Rotor Thickness | Front: 5 mm Rear: 4 mm | Front: 4 mm Rear: 3 mm | New design features thinner, lighter rotors |
| Rotor Mounting | Structure experiences bending forces | Bending forces mitigated to increase strength with reduced mass | Forces directed in tension and compression instead of bending |
| Pad Off-Gassing | Cross-drilled at two radii | Dimpled at six radii, covering entire pad area | Increased surface area for cooling while providing lower stress concentrations and improved pad off-gassing coverage |
Design Compliance Matrix
| Item | Design Authority | Priority | Description | Compliance |
| Quantity | Formula SAE Rules 2021 | 5 | Braking system must act on all four wheels T.3.1.1(a) | Two front and two rear rotors designed to comply with requirements. |
| 5 | Braking system may use a single brake if acting on a limited slip differential T.3.1.4 | |||
| University of Alberta Formula Racing Team | 5 | The UA-21 requires 4 brake rotors, 2 for the front wheels, and 2 for the rear wheels | ||
| Strength | Formula SAE Rules 2021 | 5 | Braking system must be capable of locking all four wheels T.3.1.1(c) | Brake rotors designed to withstand provided torque values when locking all four wheels |
| University of Alberta Formula Racing Team | 5 | Front rotors must be designed to withstand the expected lockup brake torque of 365 N⋅m per rotor, see Appendix C. | FEA study conducted to ensure front brake rotors can withstand 365 N⋅m of torque without yielding | |
| 5 | Rear rotors must be designed to withstand the expected lockup brake torque of 150 N⋅m per rotor, see Appendix C. | FEA study conducted to ensure rear brake rotors can withstand 150 N⋅m of torque without yielding | ||
| 5 | Brake rotors must be designed with a factor of safety minimum of 1.5 | FEA study conducted shows a factor of safety of 2.1 for front brake rotors and 2.5 for rear brake rotors | ||
| Geometry | Brembo S.p.A. | 5 | Rotor diameter must be between 180 mm and 290 mm to interface with calipers | Brake rotor diameter is 220 mm |
| 5 | Rotor thickness must be between 2 mm and 5 mm | Front brake rotor thickness is 4 mm, rear brake rotor thickness is 2.5 mm | ||
| 5 | Front rotor to pad contact height must be between 32 mm and 35 mm | Front brake rotor to pad contact height is 35 mm | ||
| 5 | Rear rotor to pad contact height must be between 34 mm and 36 mm | Rear brake rotor to pad contact height is 35 mm | ||
| University of Alberta Formula Racing Team | 5 | Front rotors must interface with Brembo brake caliper type P4 | Front brake rotor geometry designed to interface with Brembo brake caliper type P4 | |
| 5 | Rear rotors must interface with Brembo brake caliper type P2 | Rear brake rotor geometry designed to interface with Brembo brake caliper type P2 | ||
| 5 | Rotors must interface with the UA-21 wheel assemblies and be less than 230 mm to provide adequate brake to wheel clearance. UA-21 hubs FSAEX-21-XXX-WT-10003-AA (front) and FSAEX-21-XXX-WT-10004-AA (rear). | Brake rotor geometry designed to interface with UA-21 wheel assemblies, specifically the UA-21 hubs. Brake rotor diameter is 220 mm | ||
| 4 | Front rotor mass should be less than 700 g | Front brake rotor mass is 657 g | ||
| 4 | Rear rotor mass should be less than 500 g | Rear brake rotor mass is 389 g | ||
| 3 | To provide driver confidence in the expected braking performance when approaching a braking zone, rotors must provide an off-gassing method to the entire swept area of the brake pad | Dimpling is provided at 6 radii on the brake pad friction surface, providing an off-gassing method for the entire swept area of the brake pad | ||
| 2 | Rotor geometry should include appropriate clearance to allow rotor removal from UA-21 hubs without removing the hub from the upright | Clearance is provided between the brake button mounting points and the friction surface to allow the rotor to pass the UA-21 hub surface while still assembled | ||
| Thermal | Brembo S.p.A. | 5 | To prevent loss of braking effectiveness with the use of Brembo Sport brake pads, front and rear brake pad temperature must be less than 600 °C | Maximum brake temperatures are 370 °C for the front brake rotors and 184 °C for the rear brake rotors |
| University of Alberta Formula Racing Team | 5 | To stay within the manufacturer-published friction coefficient range of the brake pads, front and rear operating temperature must be less than 400 °C | Operating brake temperatures are 341 °C for the front brake rotors and 162 °C for the rear brake rotors | |
| 4 | To provide predictable results, it is desirable that the brakes achieve 95% of their operating temperature within 2 laps of the start of the endurance event | Moving average of the brake temperatures reach 95% of their operating temperature in 1.3 laps for the front brake rotors and 1.2 laps for the rear brake rotors | ||
| 3 | To provide driver confidence in the expected braking performance when approaching a braking zone, the front and rear relative standard deviation from operating temperature should be within 1% | The relative standard deviation from the operating temperature is 4.28% for the front brake rotors and 4.60% for the rear brake rotors | ||
| Budget | University of Alberta Formula Racing Team | 4 | A set of front and rear rotors should cost less than $750 to manufacture | The method of manufacturing the brake rotors is nearly the same as the previous design, which cost less than $750 to manufacture |
Appendix A: Vehicle Dynamic Model
While the brakes on a Formula SAE car are designed to meet rules requirements and function adequately in all dynamic events at competition, the endurance event is where the braking performance is most crucial. As the UA-21 vehicle is an iterative design step from the successful UA-19 and untested UA-20, the dynamic model was based on the endurance event data logs from the Formula SAE Lincoln competition held in June, 2019 in Lincoln, NE. The datalogger on the UA-19 recorded vehicle speed at sample rate of 10 Hz for the two drivers who each completed eight laps during the event.
To get an accurate representation of a high performance lap during an endurance event, the first and last lap of each driver were excluded as not representative due to the time logged before the event begins in queue, the time required to get up to speed, and the slow-down time after passing the final event timing point. To limit the effects of deceleration that was not caused by braking, these fastest laps were then filtered into discrete linear braking events chained together with non-specific linear acceleration events as seen in Figure B.1 and Figure B.2.
The energy required to slow the vehicle during braking over a lap, Qbraking, can be found as,

where n is the number of braking events in a lap, m is the mass of the vehicle in kg, and v1,i and v2,i are the speeds of the vehicle before and after braking in m/s, respectively. Comparing the results as seen in Table B.1 confirmed that Driver 2’s fastest lap, Lap 15 used the maximum energy braking, and was thus selected as the representative lap for the braking model.
Table A.1: Energy absorbed during braking for each drivers’ two fastest laps
| Driver | Lap | Lap Time (s) |
Total Energy Absorbed (kJ) |
| Driver 1 | 4 | 113.2 | 545.5 |
| 6 | 113.5 | 504.7 | |
| Driver 2 | 12 | 99.9 | 598.6 |
| 15 | 96.3 | 622.8 |
Figure A.1: Vehicle speed as a function of time and the corresponding discrete event plots for the fastest laps driven by Driver 1
Figure A.2: Vehicle speed as a function of time and the corresponding discrete event plots for the fastest laps driven by Driver 2
To simulate an endurance event, the selected representative lap’s filtered events were repeated eight times as shown in Figure A.3 to provide a complete driving session during an endurance event.
Figure A.3: Simulated endurance event session using repeated representative laps
References
| [1] | SAE International, “Formula SAE Rules 2021,” 30 July 2020. [Online]. Available: https://fsaeonline.com/cdsweb/gen/DownloadDocument.aspx?DocumentID=6d9f4b51-a642-425c-bfdf-5f95b4e5e10b. [Accessed 21 September 2020]. |
| [2] | Brembo S.p.A., “BRAKE PADS: HOW TO CHOOSE THE RIGHT ONE FOR MOTORCYCLE, SCOOTER AND OFF-ROAD,” Brembo S.p.A., 11 December 2019. [Online]. Available: https://www.brembo.com/en/company/news/brembo-guide-to-the-right-pad. [Accessed 21 September 2020]. |
| [3] | Brembo S.p.A., “Formula Student/SAE Catalogue 2014,” 2014. [Online]. Available: https://www.bremsen-center.de/brembo/downloads/racing/brembo-formula-student-katalog-2014_1.pdf. [Accessed 21 September 2020]. |
| [4] | Brembo S.p.A., “Sporting Use Brake Pads,” Brembo S.p.A., [Online]. Available: https://www.brembo.com/en/car/sporting-use/pads. [Accessed 21 September 2020]. |
| [5] | Y. A. Çengel and A. J. Ghajar, Heat and Mass Transfer: Fundamentals & Applications, 5th ed., McGraw-Hill Education, 2015. |
| [6] | M. E. Heffernan, “Analyzing and Simulating Brake Rotor Temperatures: A Technique Applied to a Formula SAE Vehicle,” SAE Technical Paper Series, no. 2006-01-1974, 2006. |
| [7] | Weather.com, “Fontana, CA, United States Monthly Weather Forecast,” TWC Product and Technology LLC, [Online]. Available: https://weather.com/en-CA/weather/monthly/l/f9b8bd04c5ca256f6f0e21643a7bbea244c5df36974a384fe839ee4268f80d8a. [Accessed 2020 October 2020]. |
| [8] | MatWeb, “Dura-Bar 80-55-06 Continuously Cast Ductile Iron Bar Stock ASTM A536,” MatWeb, LLC, [Online]. Available: http://www.matweb.com/search/datasheet_print.aspx?matguid=f9b0763303b04141a6ec67d0c1229470. [Accessed 22 October 2020]. |
| [9] | Engineering Toolbox, “Emissivity Coefficients Materials,” 2003. [Online]. Available: https://www.engineeringtoolbox.com/emissivity-coefficients-d_447.html. [Accessed 22 October 2020]. |